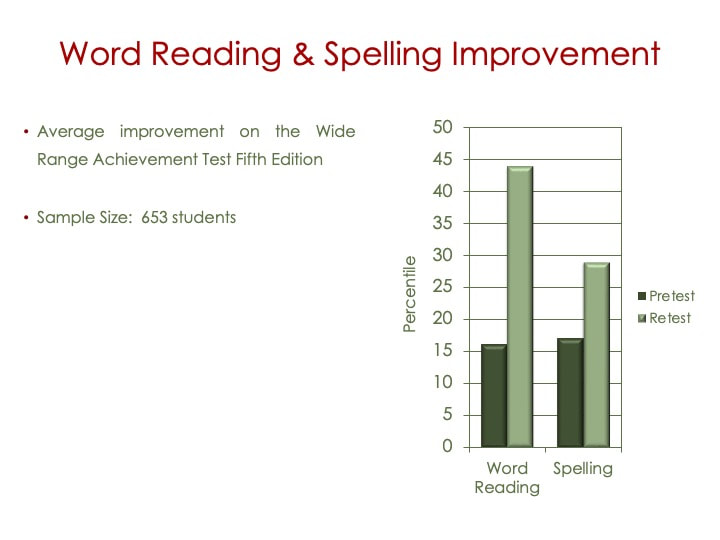
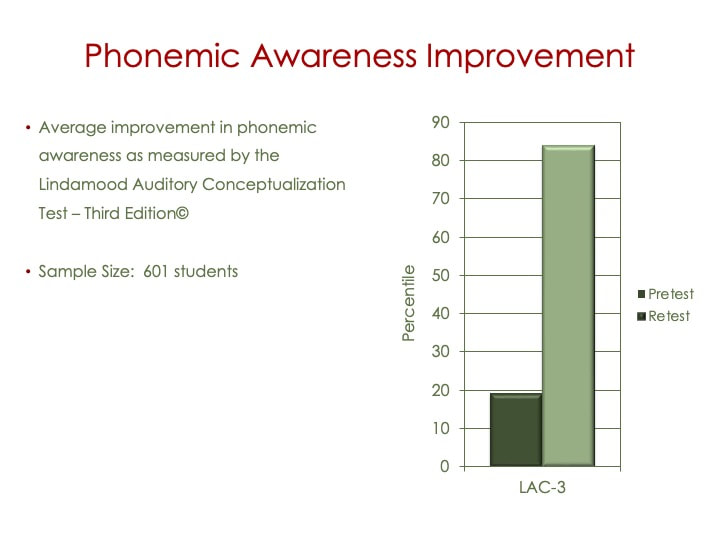
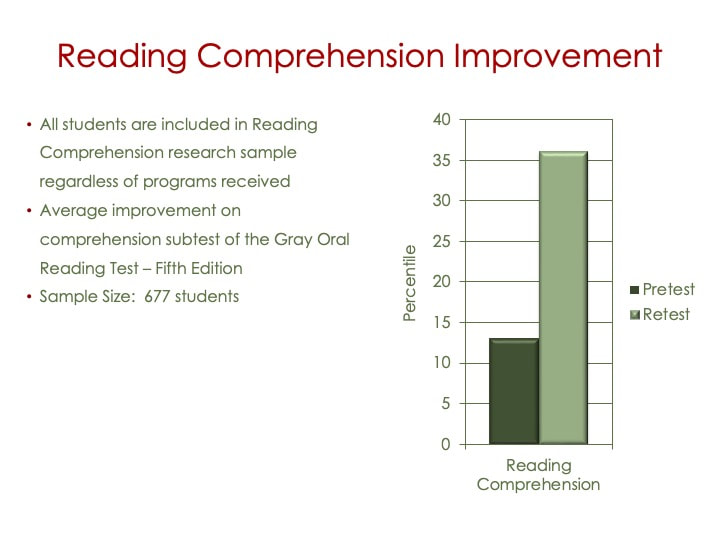
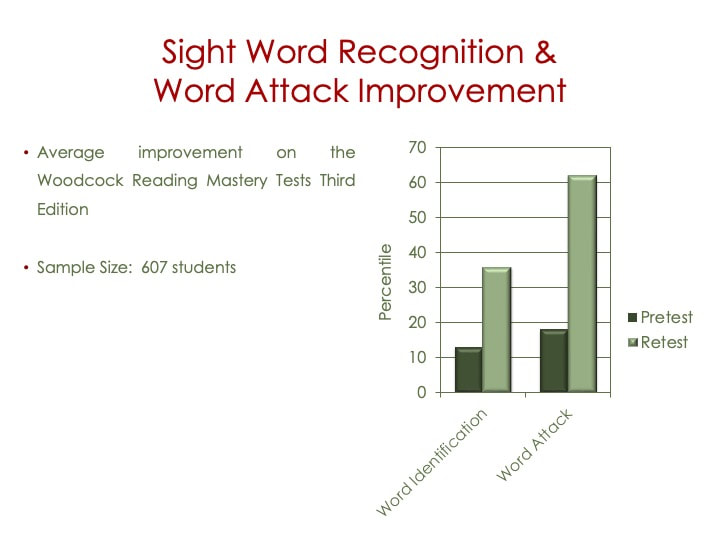
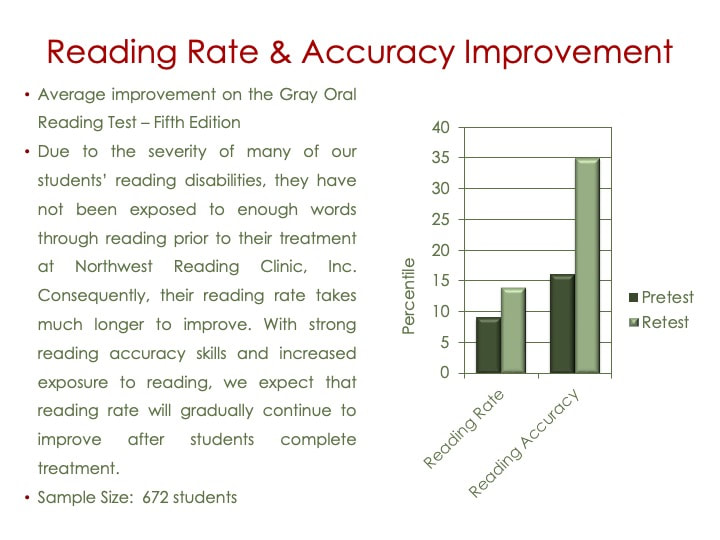
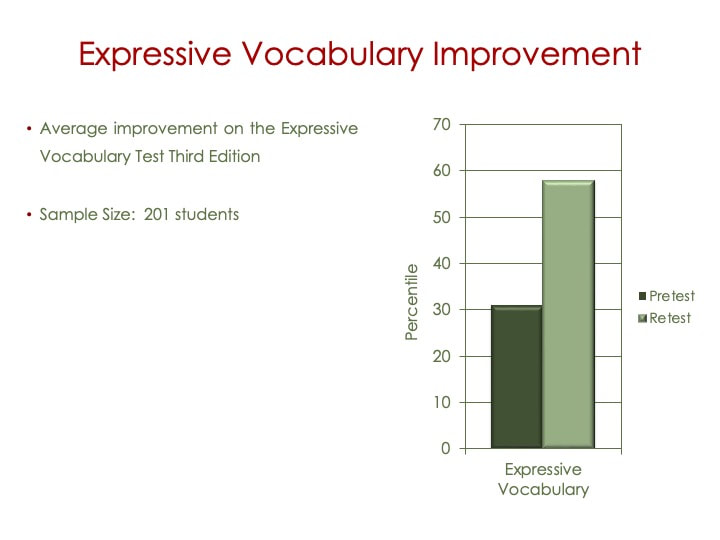
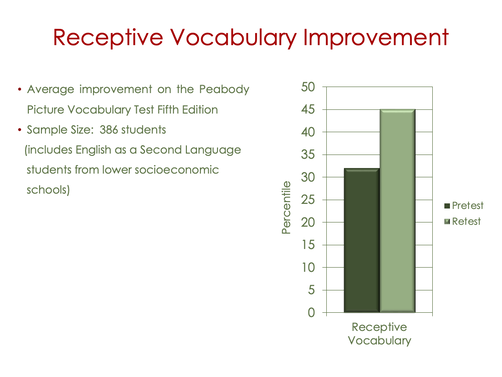
RESEARCHThe following charts represent the percentile gains (converted from standard scores) made by our students on standardized tests. The median percentile is the 50th. Generally, the average range is from the 25th to the 75th percentile.
To remain as current as possible, we update our diagnostic materials as revisions are made to the tests. For the students that begin with an older version of a test, they are retested on the newest version of the test available at the time. Consequently, the data in some of these graphs includes some students who had pretest scores from the previous test versions. By comparing standard scores rather than raw scores, the amount of growth should be comparable. |
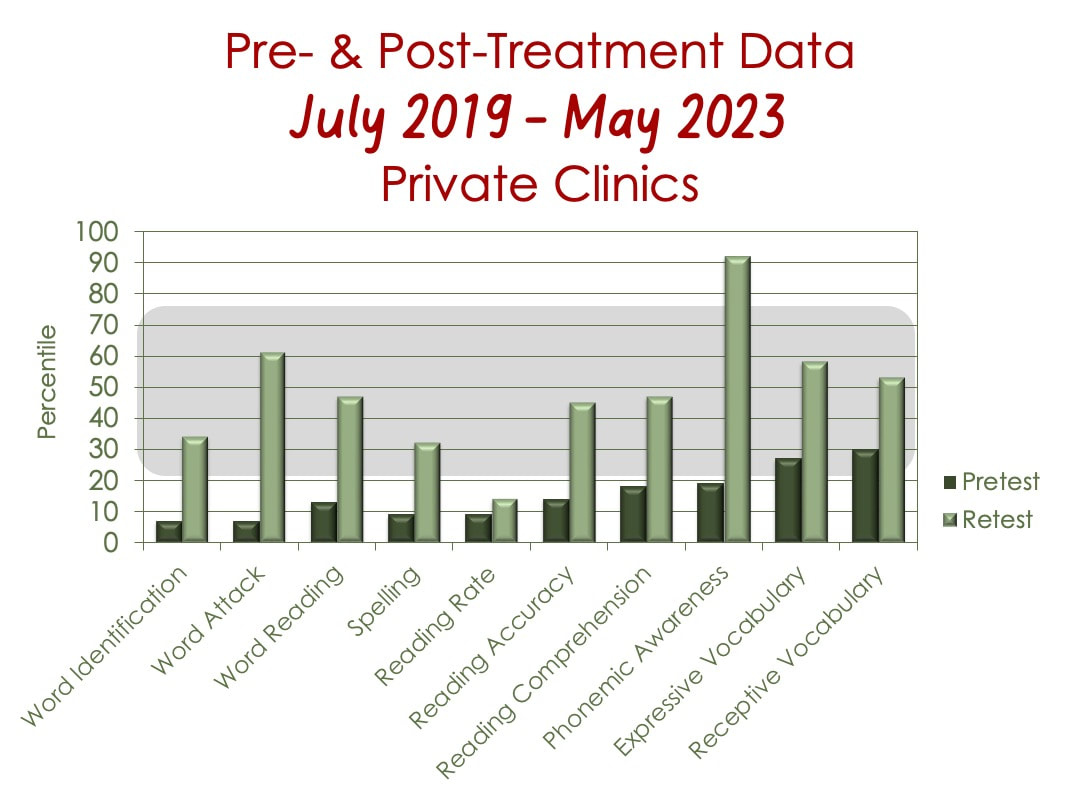
Private Clinic Research Results
The graph below illustrates research results from July 2019 through May 2023 for our private clinic students only.
Following that graph are research results for all of our students - from schools through June 2022 and from private clinics through May 2023.
Following that graph are research results for all of our students - from schools through June 2022 and from private clinics through May 2023.

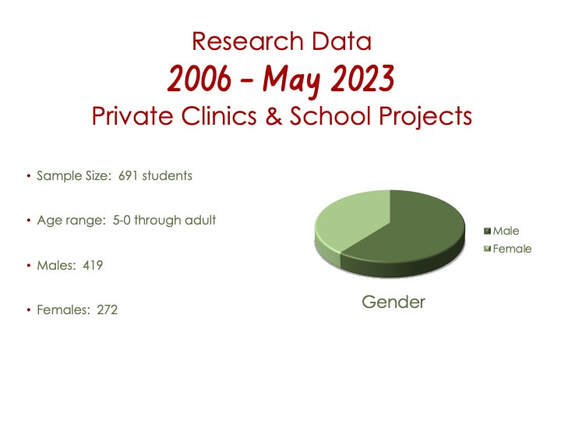
Private Clinic & School Project Research Results
|
|
TREATMENT TIME
The majority of our private clinic students attend one-hour sessions five days per week. Our students seen in the school environment typically attend for 40 minutes per day. The average time in treatment for all of our students is 120 to 160 hours. Some private clinic students attend intensively for two to four hours per day. Some attend for enhancement of their skills for 40 to 80 hours. Others return to the clinic for brief refreshers for several weeks or months. Individuals with severe disabilities may attend for a year or more.
SAMPLE SIZE
The sample size fluctuates on each graph based on the program or programs received. In addition, not all students receive all of the tests during their retesting. For instance, if a student has performed well on their initial diagnostic testing on a particular test, they are generally not tested again on this measure. This also impacts the number of students included in the graph data.
